A weld line that crosses a logo is a cosmetic issue. A weld line that crosses a pressure wall, snap arm, bolted load path, or impact zone is a structural variable. Treating both cases with the same molding-defect checklist misses the engineering question: what strength remains at this location, for this material, process, conditioning state, and load mode?
There is no trustworthy universal answer such as “use 70% of datasheet strength.” Weld line strength is not one material constant. It is the outcome of two flow fronts, their temperature and pressure when they meet, local fiber orientation, contamination or trapped gas, part geometry, and the condition in which the part is tested and used.
The practical solution is to predict the line's location, decide whether it intersects a critical load path, and then mold a paired control-and-weld specimen program. The result should be a statistically bounded design input—not a ratio copied from an unrelated grade.
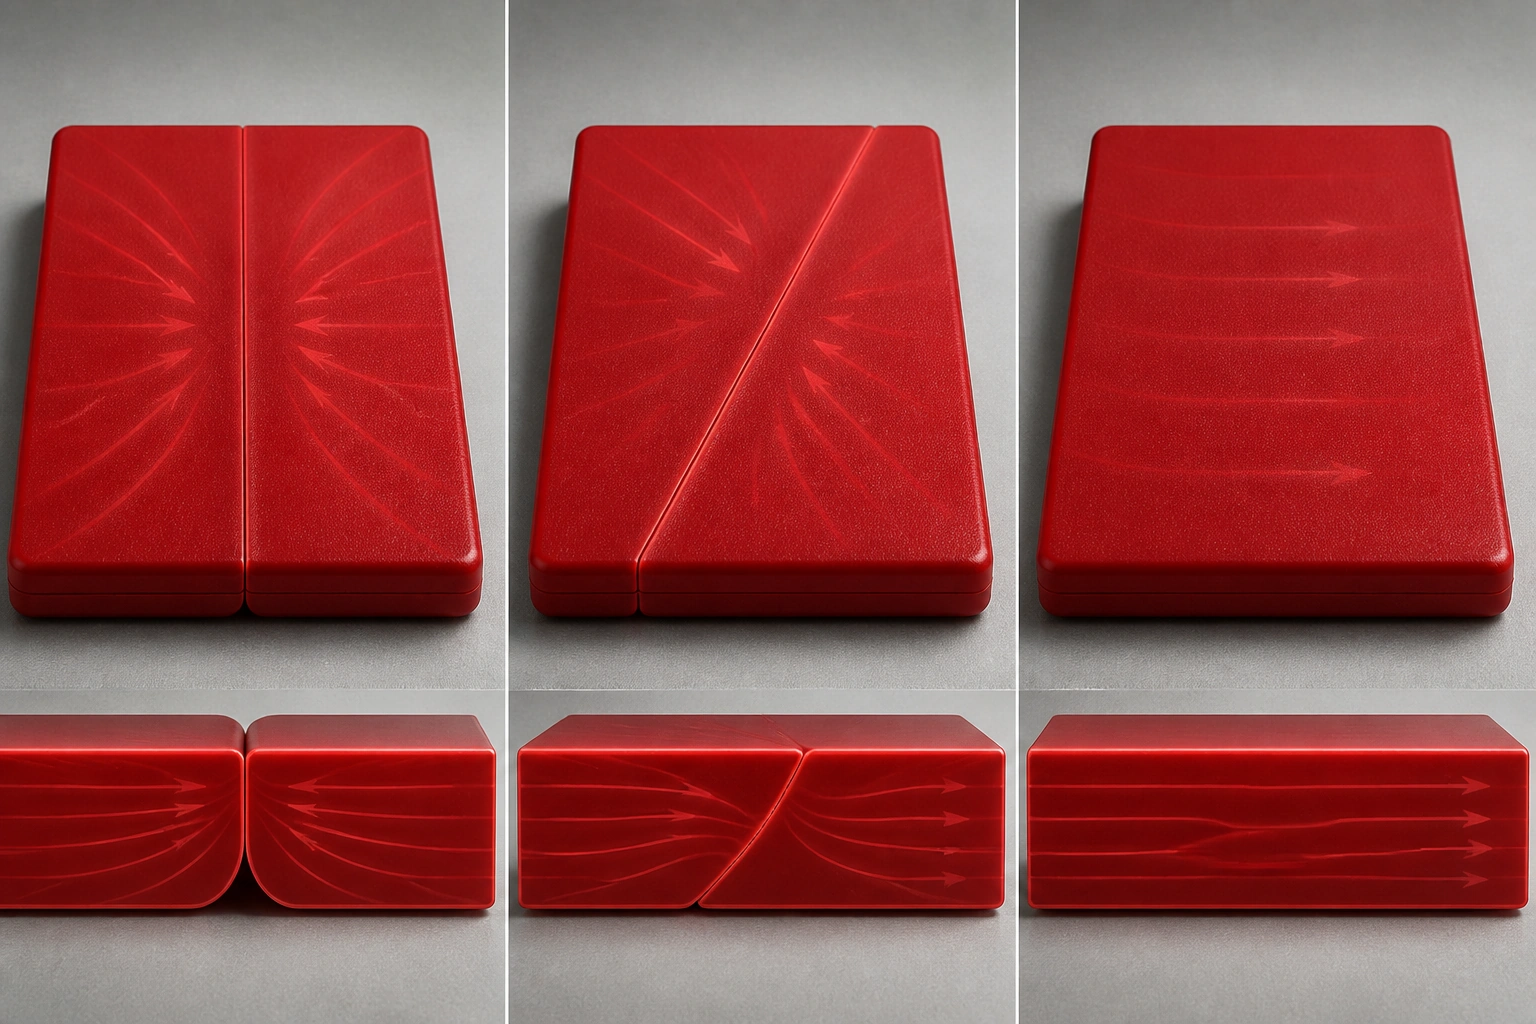
First Separate Weld Lines, Meld Lines, and Surface Flow Marks
“Weld line” and “knit line” are often used broadly for any visible line where flows meet. For structural work, the meeting geometry matters.
-
A weld line forms when divided flow fronts meet more nearly head-on. The frozen skins and molecular orientation at the two fronts do not merge as effectively as continuous flow.
-
A meld line forms when fronts converge more obliquely and continue flowing together. It is often less severe, although it still requires evaluation when it crosses a critical region.
-
A flow mark describes a surface appearance associated with changing front velocity, cooling, or flow behavior. A visible mark is not, by itself, a measured strength reduction.
Autodesk's Moldflow documentation distinguishes weld and meld lines by convergence angle and notes that the result depends on temperature and pressure where the fronts meet. It also warns that a coarse mesh may miss some lines.[1] The software's 135-degree classification is a modeling convention, not a universal mechanical-strength boundary. A simulation can locate and characterize convergence; it does not create a design allowable for the molded material.
Why Fiber-Filled Materials Need Their Own Evidence
For an unfilled thermoplastic, healing across the interface depends strongly on molecular interdiffusion before the fronts freeze. Higher interface temperature, adequate pressure after meeting, and clean venting can therefore improve bonding.
Short-fiber composites add an orientation problem. Near a weld plane, fibers tend to align along that plane rather than bridge it. The nominal datasheet strength may have been measured in a favorable flow direction, while the critical part load acts across a locally unfavorable orientation. Experiments on short-glass-fiber-reinforced polyamide 6,6 found that flow-induced fiber orientation changed the tensile properties and that a weld line reduced modulus, strength, and failure strain.[2] Research on short-fiber-reinforced polypropylene likewise found that weld strength depended on fiber content and type, with the weld-region behavior not fully described by a simple matrix-strength assumption.[3]
This is why neither of the following shortcuts is safe:
-
assuming the weld line falls all the way to neat-resin strength; or
-
applying a fixed percentage of reinforced datasheet strength.
Some fibers cross the interface, the skin and core layers have different orientations, and the matrix, fiber content, fiber length, gate geometry, and process all change the result. Measure the actual grade and state the comparison baseline.
Mineral-filled and hybrid-filled grades also need their own molded evidence. Their weld-line strength, orientation, warpage, and surface tradeoffs should not be inferred from either an unfilled polymer or a glass-fiber study merely because the base resin name is the same.
Published Numbers Show Scale, Not a Transferable Factor
A 2023 study molded PA6 with 30% fiberglass in a two-gate tensile configuration and varied filling time, packing time, packing pressure, melt temperature, and local mold temperature. Under that study's specimen geometry and settings, reported weld-line ultimate tensile strength values ranged from 67.2 MPa to 76.8 MPa, while elongation was generally below 5% for most of the process trials.[4]
Those values are useful as evidence that a weld-line region can be both weaker and less ductile. They are not a design allowable for another PA6-GF30 grade. The study used a specific material, machine, mold, parameter window, specimen, test speed, and dry/conditioning history. A production part with a different wall, gate, moisture state, fiber orientation, or load spectrum may behave differently.
The same caution applies to a weld line factor:
Mean weld line factor =
mean strength of weld-line specimens / mean strength of matched control specimens
The equation is easy. The difficult—and important—part is defining “matched control” and converting a mean ratio into a lower-bound value suitable for design.
The Baseline Can Change the Factor Dramatically
Suppose the weld specimens are tested dry as molded, but the bulk material value comes from conditioned data. The calculated factor mixes weld-line damage with moisture conditioning. Reverse the two states and the factor changes again.
Polyamide makes this problem visible. ISO 1110:2019 defines an accelerated conditioning method intended to approach the equilibrium moisture content at 23°C and 50% relative humidity, while warning that the resulting mechanical properties can differ slightly from standard-atmosphere conditioning.[5] A BASF datasheet for one PA66-GF30 grade reports tensile stress at break of 190 MPa dry and 130 MPa conditioned at 23°C.[6] Those figures belong only to that grade and test method, but they demonstrate the size of the baseline shift moisture can create.
Every reported weld line factor should therefore state:
-
exact resin producer, grade, color, filler type, and filler content;
-
resin lot and regrind content, if any;
-
specimen thickness, gate design, and weld position;
-
molding settings and measured melt/mold conditions;
-
dry-as-molded, conditioned, or service-equilibrated state;
-
test temperature, test method, speed, and load direction;
-
whether the denominator is a same-lot molded control or a datasheet value.
A factor without those fields has little engineering meaning.
Mold a Paired Control-and-Weld Test
The cleanest screening design uses two specimen conditions:
-
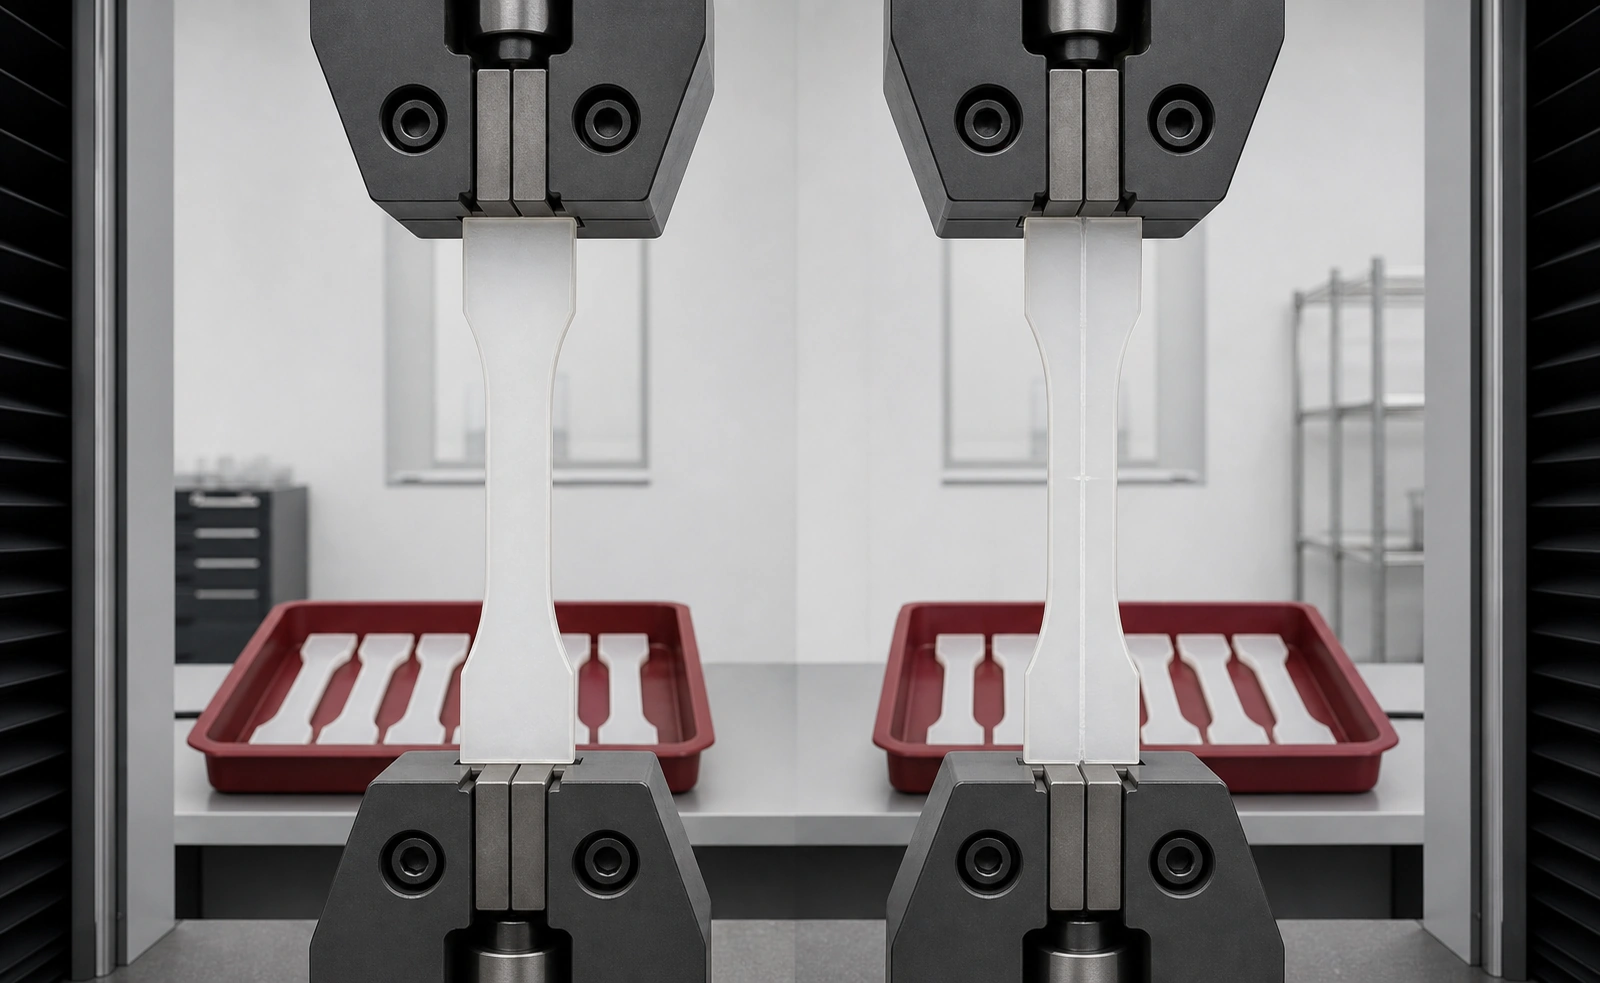
Single-gated control specimens create continuous flow through the gauge section.
-
Double-gated weld specimens make the two fronts meet at a controlled point, typically near the center of the gauge section.
Use the same resin lot, drying and handling, nominal thickness, mold thermal condition, machine, and approved process window. Record actual pressure, fill time, cushion, temperatures, and conditioning. If the two specimen designs require different shot sizes or pressure histories, record the difference instead of calling them identical.
ISO 527-1:2019 specifies general principles for determining tensile properties of plastics and composites under defined conditions.[7] Select the applicable specimen and material-specific part of ISO 527—or an agreed ASTM method—and use that method for both groups. Do not compare an ISO-molded control with a nonstandard production coupon unless the difference is deliberately part of the program.
Choose Replicates From the Decision Risk
“Test at least five” is not enough to create a universal design rule. Five specimens may be an initial materials-screening set, but a design allowable often needs more evidence. Run a pilot to estimate variability, then set sample size and acceptance statistics from the required confidence, consequence of failure, cavity count, process sources, and material-lot scope.
Useful outputs include:
-
individual tensile strength and strain-at-break results;
-
mean, standard deviation, and confidence interval for each group;
-
failure location and fracture appearance;
-
the paired mean factor for comparison;
-
a pre-agreed one-sided lower confidence or tolerance bound for design use;
-
results separated by cavity, material lot, and conditioning state when those sources are in scope.
If a test specimen breaks outside the intended weld region, do not silently average it into the weld-line dataset. Investigate whether the weld was stronger than another defect, the line missed the gauge section, or the specimen/test setup failed.
A Mean Factor Is Not Yet a Design Allowable
The mean factor describes the average knockdown in the tested groups. A design allowable should protect against expected lower-tail variation and match the service condition. The statistical method depends on the company's design code and consequence of failure; it may use a one-sided lower confidence bound, a material tolerance bound, or another approved basis.
A defensible workflow is:
-
establish the base-material allowable for the same grade, direction, temperature, moisture state, and load mode;
-
calculate the weld-line distribution from matched specimens;
-
derive an approved lower-bound weld knockdown, rather than using only the mean ratio;
-
apply any separate environmental, aging, manufacturing, and safety factors required by the product standard;
-
verify the final part in the real geometry and load path.
Do not transfer a static tensile factor to impact, fatigue, creep, pressure cycling, or environmental stress cracking. Those failure modes respond to notches, strain rate, time, temperature, chemicals, and crack initiation differently. If the product requirement is impact or cyclic life, test that mode on representative molded geometry.
Optimize the Process With a Designed Experiment, Not a Universal Ranking
Temperature, pressure, velocity, venting, and material condition can all affect the interface. The PA6-GF30 study cited above found that packing pressure produced the largest strength variation among the parameter ranges it examined, while melt temperature strongly affected elongation.[4] That is a result for one experiment—not proof that packing pressure must always be adjusted first.
Use a controlled design of experiments around the supplier-approved processing window and evaluate both strength and competing risks:
| Variable | Why it may help the interface | What can limit the change |
|---|---|---|
| Melt temperature | Keeps the fronts mobile and supports interdiffusion | Resin degradation, color change, residence time, additives |
| Mold temperature | Slows skin freeze at convergence | Cycle time, crystallinity, warpage, dimensional change |
| Fill velocity | Changes front temperature and meeting behavior | Shear heating, burn, jetting, orientation, pressure demand |
| Packing pressure/time | Maintains contact after the fronts meet | Gate freeze, overpacking, flash, residual stress |
| Venting at convergence | Removes air and volatiles that can block contact | Flash risk and grade-specific vent limits |
For fiber-filled grades, processing may improve the interface but cannot erase the orientation field created by geometry. A line can become less visible without achieving the required mechanical lower bound. Retest strength after the process change.
Geometry Usually Has More Leverage Than Process
If a critical load crosses a weld line, the most robust action is often to change where or how the fronts meet:
-
move or resize the gate so convergence occurs in a lower-stress region;
-
change local wall thickness or add a controlled flow leader/deflector to steer the fill pattern;
-
use sequential valve gating where the part and hot-runner architecture justify it;
-
add an overflow where it can move the convergence region out of the functional section and be removed safely;
-
alter the load path, add section depth, or reduce the local stress concentration;
-
compare another grade only after checking its full mechanical, thermal, moisture, shrinkage, regulatory, and processing requirements.
Simulation is valuable for overlaying predicted weld locations on structural load paths, visualizing meeting angle, and reviewing front temperature and pressure. It should be correlated with short shots or trial parts, and strength should still come from testing. Our weld-line guide identifies gate placement as one way to move convergence, our mold-flow analysis overview describes predicted flow, temperature, and pressure, and our inspection workflow provides public quality-process context. For a structural part, make the deliverable explicit: request the weld-line overlay and the agreed coupon or part-level validation plan before steel release.
Frequently Asked Questions
What is a typical weld line strength factor in injection molding?
There is no universally valid factor. The value depends on grade, reinforcement, fiber orientation, specimen geometry, process, conditioning, test method, temperature, and the baseline used in the denominator. Use published values for screening only and test the actual material system.
Can Moldflow predict weld line strength?
Moldflow can predict where fronts meet and report meeting angle and process conditions at convergence.[1] Those results help rank risk and place tests. They do not replace a statistically supported mechanical allowable for the molded grade.
Why use both single-gated and double-gated tensile bars?
The single-gated bar establishes bulk molded performance under a matched material and process. The double-gated bar places a weld line in the gauge section. Comparing the two reduces the error created by using a supplier datasheet from different molding and conditioning conditions.
Should nylon weld-line specimens be tested dry or conditioned?
Test the state that represents the design decision. For many PA applications, that means at least a dry-as-molded state and a defined conditioned or service-equilibrated state. Report the method and moisture condition; do not combine states in one factor.
Will higher melt or mold temperature always strengthen a weld line?
No. Higher interface temperature can improve bonding, but the safe range is grade-specific and other outcomes may worsen. The PA6-GF30 study found non-monotonic results across some settings.[4] Optimize inside the material supplier's approved window and confirm by test.
Conclusion
Weld line strength in injection molding cannot be reduced to a cosmetic rating or a borrowed percentage. Start by asking whether the line crosses a critical load path and whether reinforcement makes local orientation important. Then mold same-lot single-gated controls and double-gated weld specimens, keep conditioning and test conditions explicit, and report the distribution—not just the best result.
Use the mean weld line factor for comparison, but derive the design input from an approved lower-bound method and verify the relevant load mode on the real part. Process optimization can improve the interface. Gate placement, flow-path geometry, and load-path design determine whether the interface must carry the load at all.
Sources
[1] Autodesk Moldflow: Weld Lines Result
[3] Mechanics of Materials: Weld Strength of Injection-Molded Short-Fiber-Reinforced Polypropylene
[5] ISO 1110:2019: Plastics—Polyamides—Accelerated Conditioning of Test Specimens
[6] BASF: Ultramid A3EG6 PA66-GF30 Product Information
[7] ISO 527-1:2019: Plastics—Determination of Tensile Properties—General Principles