-1.png)

Calling a part "under 1 mm" does not determine whether it can be molded. A short cup and long housing can share a wall thickness but have different pressure, speed, weld-line, venting, and deflection risks. Resin grade, gates, flow path, runner loss, temperatures, and the installed injection unit all change the answer.

The correct first question in thin wall injection molding is therefore not "What is the minimum wall?" It is: Can the intended resin fill this geometry through the complete feed system, on the named machine, with usable pressure, flow-rate, clamp, and thermal margins?
Thin Wall Is a Coupled Requirement, Not a Universal Threshold
Wall thickness is only one part of flow resistance. Autodesk notes that thin restrictions, small runners, high material viscosity, and long flow length all increase the pressure gradient required to fill a mold. [1] A flow-length-to-thickness ratio, often written as L/t, is useful for screening because it combines two of those variables. It is not a machine-selection formula and it does not capture branches, corners, gates, hesitation, resin rheology, or cooling.
Published examples show why a universal minimum-thickness table is misleading. BASF documents two parts made with one specific easy-flow PBT grade, Ultradur B1520 FC R01: a 0.7 mm center-gated cup with a 100 mm flow length and a 0.5 mm center-gated container with a 140 mm flow length. Those geometries correspond to approximate L/t values of 143:1 and 280:1, but one uses a cold runner and the other a hot runner. [2]
| Published evidence | What it supports | What it does not prove |
|---|---|---|
| 0.7 mm wall, 100 mm flow, center gate, cold runner; Ultradur B1520 FC R01 | That this documented grade and example geometry reached about 143:1 | That every PBT grade or 0.7 mm part can do so |
| 0.5 mm wall, 140 mm flow, center gate, hot runner; the same documented grade | That a grade-specific example reached about 280:1 with a different feed system | That 0.5 mm is a general PBT minimum or that any machine is suitable |
Use L/t to decide which projects need full flow analysis. Use grade-specific viscosity, thermal data, gate and runner geometry, and machine limits to decide feasibility.
Filling Is a Race With Two Opposing Speed Effects
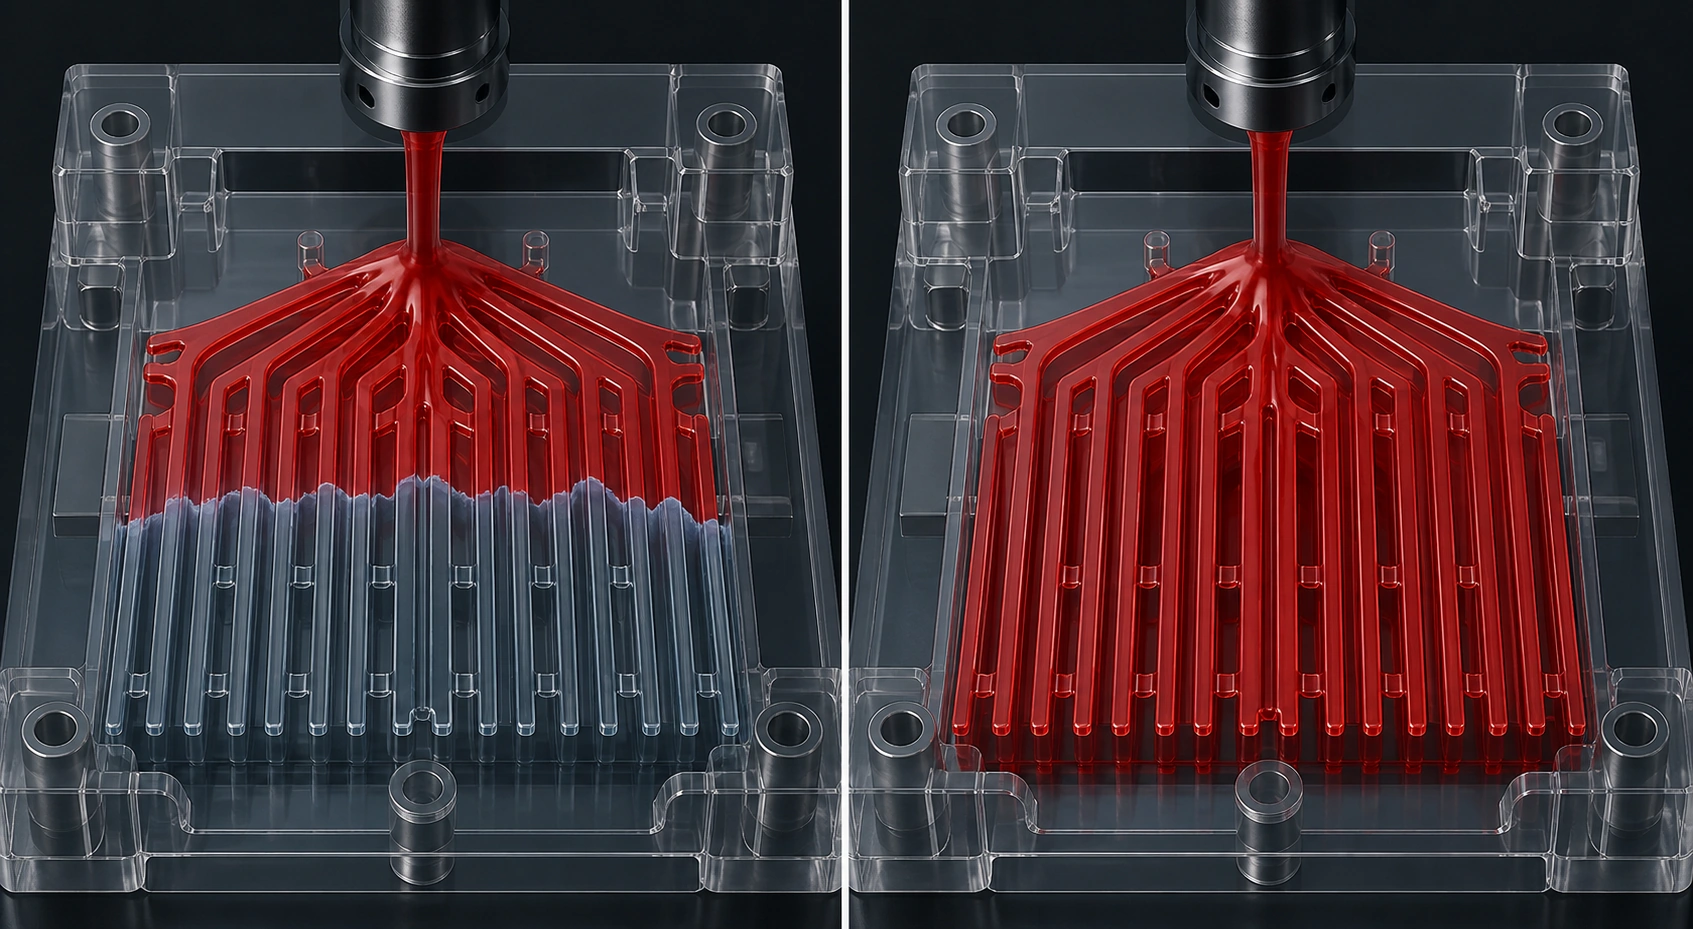
Thin cavities cool rapidly at the wall, leaving a smaller molten flow channel. Filling faster can reduce time for freeze-off and can add shear heating, but "faster is always easier" is also wrong. Autodesk's fill-time model shows a pressure minimum: at very short fill times, forcing melt through the cavity requires more pressure; at long fill times, heat loss raises viscosity and frozen-layer thickness, which also raises pressure. [3]
Covestro's thin-wall calculation guide shows the same interaction through the thickness. In its example, a 1 mm section had stronger shear heating than a 3 mm section under the stated conditions, yet a lower cross-section-average temperature because cooling was more pronounced. The guide also documents hesitation where melt temporarily stopped in a thin film hinge while the lower-resistance thick section filled first. [4]
That means the feasibility study must solve for a fill-time window, not merely command maximum injection speed. Review at least:
-
pressure through the complete runner-and-cavity system;
-
flow-front temperature and frozen-layer development;
-
shear rate and stress against grade-specific guidance;
-
velocity-to-pressure transfer and residual filling pressure; and
-
air-trap and weld-line locations.
The fill model is an engineering input, not proof that the physical tool will behave identically. T1 short shots and machine pressure, position, and time traces should be compared with the predicted fill sequence.
Match the Injection Unit, Not Just the Press Tonnage
A press model name does not describe one fixed injection capability. Screw diameter changes pressure, shot volume, and available injection flow. In ARBURG's published ALLROUNDER 570 H packaging data, for example, the 400 injection unit is listed at 2,500 bar and 492 cm³/s with a 35 mm screw, versus 2,000 bar and 642 cm³/s with a 40 mm screw. Those figures are machine-specific, but they demonstrate the pressure-flow trade-off that a quote must resolve. [5]
Build a machine-fit sheet using the actual press configuration:
| Check | Evidence needed before commitment | Why it can fail a thin-wall job |
|---|---|---|
| Required injection pressure | Simulation with intended resin, feed system, and temperatures | A cavity-only value omits feed-system loss |
| Maximum plastic injection pressure | Data for the installed screw and injection unit | Maximum pressure can change with screw diameter |
| Injection flow and acceleration | Required profile versus machine capability | Peak speed may arrive too late without acceleration |
| Shot size and residence | Part, runner, cushion, barrel, and cycle | A poor relationship reduces control or extends thermal history |
| Clamp requirement | Pressure integrated over projected area | Tons-per-area ignores pressure distribution and stage |
| Mold fit and support | Tie bars, platen, daylight, mass, supports, ejection | Pressure and tonnage do not prove physical fit or rigidity |
Autodesk uses 75% of known machine pressure capacity as a design guide for the entire modeled mold, including runners. That is a software guideline rather than a universal acceptance limit, but it illustrates the need for operating margin rather than a simulation that merely stays one unit below the nameplate maximum. [1]
Calculate Clamp Force From Cavity Pressure Distribution
Clamp demand is not injection pressure multiplied by the bounding-box area. It is the integral of local cavity pressure over projected area, including all cavities and relevant runners. Pressure and clamp force can peak during either filling or packing, depending on the pressure history. [6]
For a multi-cavity thin-wall mold, confirm:
-
Projected area in the clamp direction.
-
Pressure distribution during fill and pack.
-
Overlaps, slides, or stack geometry requiring manual interpretation.
-
Project-specific margin, clamp calibration, and platen condition.
Excess clamp does not compensate for weak mold support. It can load the tool and machine while local cavity pressure still bends a core, plate, or unsupported region.
Mold Stiffness Can Become a Wall-Thickness Variable
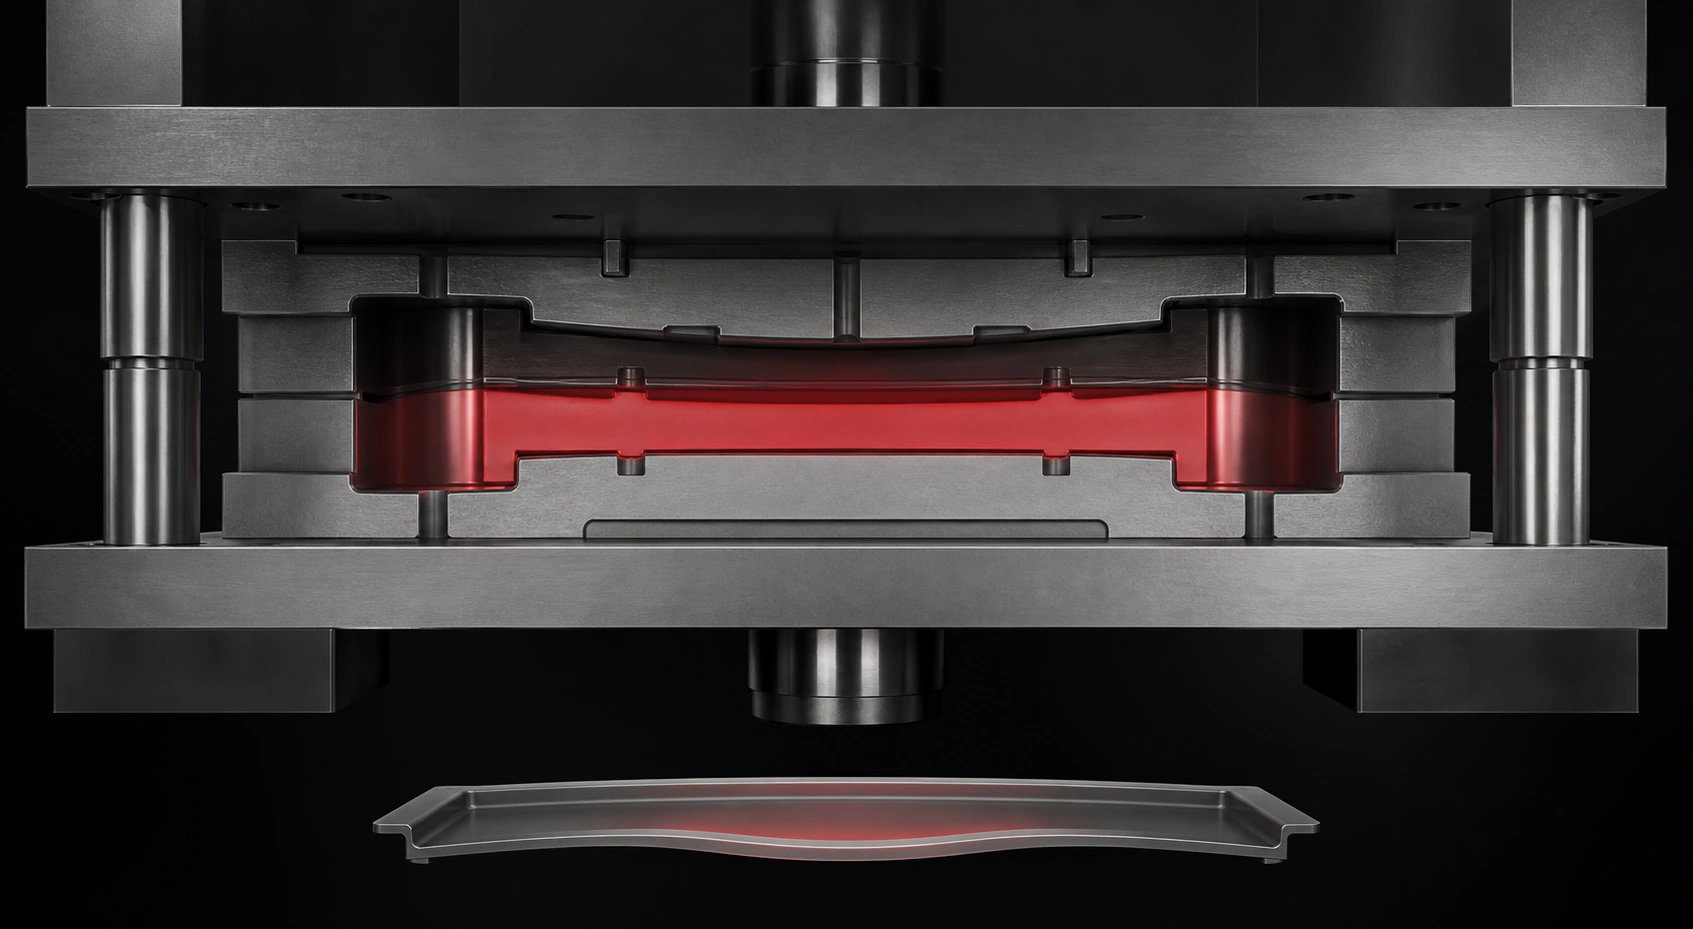
At thin sections, a small core movement becomes a large percentage of the nominal wall. Autodesk identifies machining or setup error, platen or mold-plate deflection, and pressure imbalance on opposite sides of a core as three contributors to core shift. Its analysis transfers the predicted pressure field into a structural model to calculate core deflection and the resulting thickness change. [7]
The tooling review should therefore include structural behavior, not just nominal steel dimensions:
-
plates and pillars supporting the loaded cavity region;
-
core section, guidance, and pressure balance;
-
interlocks and slide locks controlling alignment;
-
gates that limit pressure imbalance on slender cores;
-
parting-line support under predicted pressure; and
-
distributed ejection for flexible parts.
Flash on one side, asymmetric wall thickness, and a pressure-dependent dimensional shift may be consistent with deflection or core movement, but each can have other causes. Confirm the pattern against cavity pressure, parting-line evidence, and repeated measurements before modifying the mold.
Select a Grade With Processing Data, Not MFR Alone
A high melt mass-flow rate (MFR) can help screen candidates within a comparable material family and test condition. It is not a high-shear cavity-flow curve. ISO 1133-1:2022 states that its MFR/MVR shear rates are much lower than normal processing rates and that results may not correlate with processing behavior; the tests are used primarily for quality control. [8]
For thin-wall feasibility, obtain grade-specific viscosity, pressure-volume-temperature and thermal data, transition or crystallization behavior, and supplier temperature and shear limits. Reinforcement can change viscosity, orientation, wear, shrinkage, and weld lines together, so "filled" is not one correction factor.
When a supplier publishes a spiral-flow chart, preserve its conditions. BASF's Ultraform guide, for example, reports grade comparisons using a 30 mm screw, a 1,000 bar injection pressure, 200°C melt, and 80°C mold in the stated spiral test. A flow length taken out of that setup is not a free-standing property of all POM parts. [9]
High local melt velocity through a small gate can combine with glass or mineral reinforcement to concentrate wear at the gate and runner. The tool specification should therefore identify the replaceable gate boundary, steel grade and hardness range, heat treatment, any coating, and a measurable baseline for later wear checks. Uddeholm's mold-steel guidance connects abrasive molding compounds and gate-region demands with wear-resistant steel and surface-treatment decisions, while still requiring toughness and substrate support. [11] A harder insert or coating does not correct excessive shear, an unsuitable gate, or poor support; the final choice remains grade-, geometry-, life-, and repair-specific.
The Process Window Must Include Cooling and Gate Freeze
The short cycle is a real attraction of thinner walls. For flat sections under the assumptions in its cooling model, BASF shows cooling time proportional to wall thickness squared. The same guide adds an important counterweight: although a thinner wall contains less heat, the cooling system must remove that heat in less time to achieve the theoretical minimum cycle. [10]
Do not assume packing is irrelevant because the wall is thin. Establish the velocity-to-pressure transfer, gate-freeze behavior, part-weight plateau, and dimensional response for the actual gate and grade. A small gate may freeze quickly; a hot runner or larger gate may preserve a longer packing path. The acceptable window should cover fill time, peak pressure, transfer position, cushion, part weight, critical dimensions, flash, weld-line condition, and ejection stability.
Use controlled changes to diagnose T1 results:
-
A short shot near the pressure limit can involve flow resistance, temperature, material, feed system, venting, or machine delivery.
-
A fixed last-to-fill burn supports checking vent location and capacity against staged short shots and predicted air traps.
-
Pressure-related flash can involve support, clamp, shutoffs, or an aggressive process.
-
Gate-direction wall asymmetry supports checking core shift; pre-molding asymmetry supports checking machining or setup.
-
Warpage can involve orientation, cooling, residual stress, or early ejection.
Put Feasibility Into the DFM Gate
Our plastic injection molding service and clamping-force guide provide public scope and planning context. Our inspection workflow says the DFM report reviews tolerances and potential quality issues and that a full-dimensional report follows T1 samples. On a thin-wall program, use those checkpoints to agree on the exact resin grade, flow-model inputs, machine configuration, pressure and clamp margins, core-deflection review, vent and gate plan, and T1 process-window evidence. Those items are project requirements; they should not be assumed from the phrase "thin wall."
Frequently Asked Questions
Is any part below 1 mm considered thin wall?
Below 1 mm is a useful warning flag for many applications, but it is not a universal boundary. Flow length, grade, gate layout, runner system, temperature, required pressure, and machine delivery determine difficulty.
Is a high flow-length-to-thickness ratio automatically impossible?
No. Supplier examples can reach high ratios with specific easy-flow grades, gates, and runner systems. Treat L/t as a screening value, then verify the complete geometry and machine through grade-specific simulation and trial evidence.
Does a thin-wall part always require an all-electric press?
No. Electric, hydraulic, and hybrid architectures can all be configured for demanding work. Compare the required pressure, injection flow, acceleration, control repeatability, clamp, and shot configuration with the actual machine rather than choosing by drive label alone.
Conclusion
Thin wall injection molding is an equipment-and-tool feasibility problem before it is a wall-thickness guideline. Screen with wall thickness and L/t, then model the production resin through the complete feed system. Compare pressure and flow with the installed injection unit, calculate clamp from cavity pressure distribution, analyze tool deflection, and prove a window covering venting, transfer, gate freeze, cooling, and ejection. A shorter cycle is valuable only when the machine and mold can deliver it with operating margin.
Sources
[1] Autodesk Moldflow: Pressure result and machine-pressure design guidance
[2] BASF: Ultradur B1520 FC R01 thin-wall product examples
[3] Autodesk Moldflow: Injection time
[4] Covestro: Calculating the Mold-Filling Process for Thin-Walled Injection Moldings
[5] ARBURG: ALLROUNDER 570 H Packaging Technical Data
[6] Autodesk Moldflow: Modeling for Accurate Clamp Force Prediction
[7] Autodesk Moldflow 2026: Core Shift Simulation
[8] International Organization for Standardization: ISO 1133-1:2022, Determination of MFR and MVR
[9] BASF: Ultraform POM Product Brochure and Spiral-Flow Conditions