-1.png)

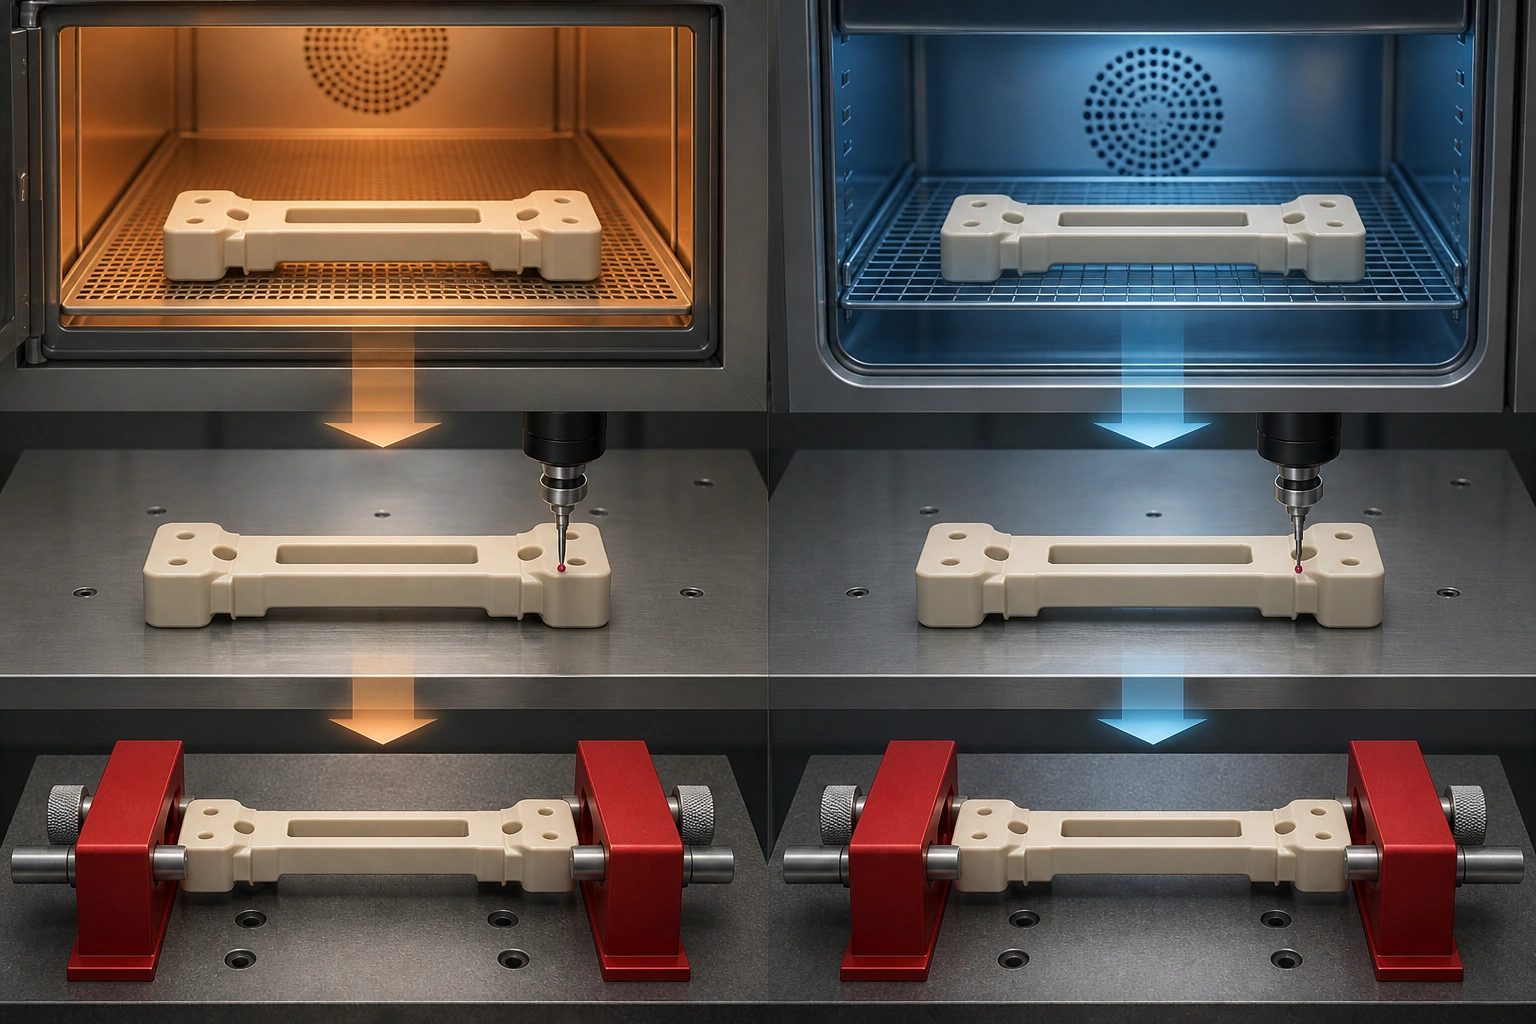
When a molded part passes inspection at the press and fails at the customer's site, neither measurement has to be false. This is a classic post-mold shrinkage dispute: the part, its environment, or its constraint state may have changed between the two readings.
The dispute cannot be resolved by measuring the same undefined way more accurately. It requires a common clock and a common condition. Record when the part was ejected, what happened before each measurement, the temperature and humidity at inspection, whether the part was free or fixtured, and whether a moisture-sensitive resin was dry-as-molded or conditioned. Then plot the same critical dimensions over time. The shape of that curve is more diagnostic than either site's isolated result.
Four Mechanisms Can Move a Dimension After Ejection
ISO 294-4:2018 distinguishes molding shrinkage from post-molding shrinkage and covers measurements parallel and normal to flow. Its definition of molding shrinkage excludes humidity uptake, while humidity-related dimensional change is included in post-molding and total shrinkage. The ISO page lists the 2018 edition as published and confirmed in 2024. [1]
That framework helps separate four mechanisms that can overlap in a production part.
| Mechanism | Typical time signature | What happens if the environment returns to the starting condition? |
|---|---|---|
| Cooling and thermal contraction | Fast change after ejection, then a plateau as temperature equalizes | The thermal component is substantially reversible with temperature, but it may be mixed with permanent shrinkage. |
| Continued crystallization or structural relaxation | Gradual movement over hours, days, or longer, accelerated by heat in some semi-crystalline grades | It is not normally undone simply by cooling the part back to inspection temperature. |
| Frozen-in orientation and stress relaxation | Drift or warpage over time, or a step change after heating or assembly | Relaxed stress is not restored by returning to the previous temperature. |
| Moisture uptake or loss | Change follows exposure, thickness, resin grade, and relative humidity; nylon is a common concern | It can move toward a new moisture equilibrium and may be partly reversible, but the path and time are grade- and geometry-dependent. |
The mechanisms are not identified by timing alone. A warm, humid environment can accelerate crystallization, relax stress, change part temperature, and add moisture at the same time. A time study narrows the hypotheses; controlled conditioning and targeted follow-up tests confirm them.
Build a Time Signature Instead of Choosing One Waiting Period
A practical screening study can measure the same marked parts near ejection, at one hour, 24 hours, 48 hours, and seven days. These points are not a universal standard and 48 hours is not an automatic acceptance time. They are a way to see whether the measurement is still moving on the project's time scale.
Use the study as follows:
-
Assign part, shot, and cavity identifiers. Repeatedly measuring different untracked pieces can confuse process variation with movement over time.
-
Record ejection time and the actual time of every reading. “Day two” is not precise enough when early movement is rapid.
-
Keep the parts in one defined environment except when a deliberate humidity or heat exposure is the variable under study.
-
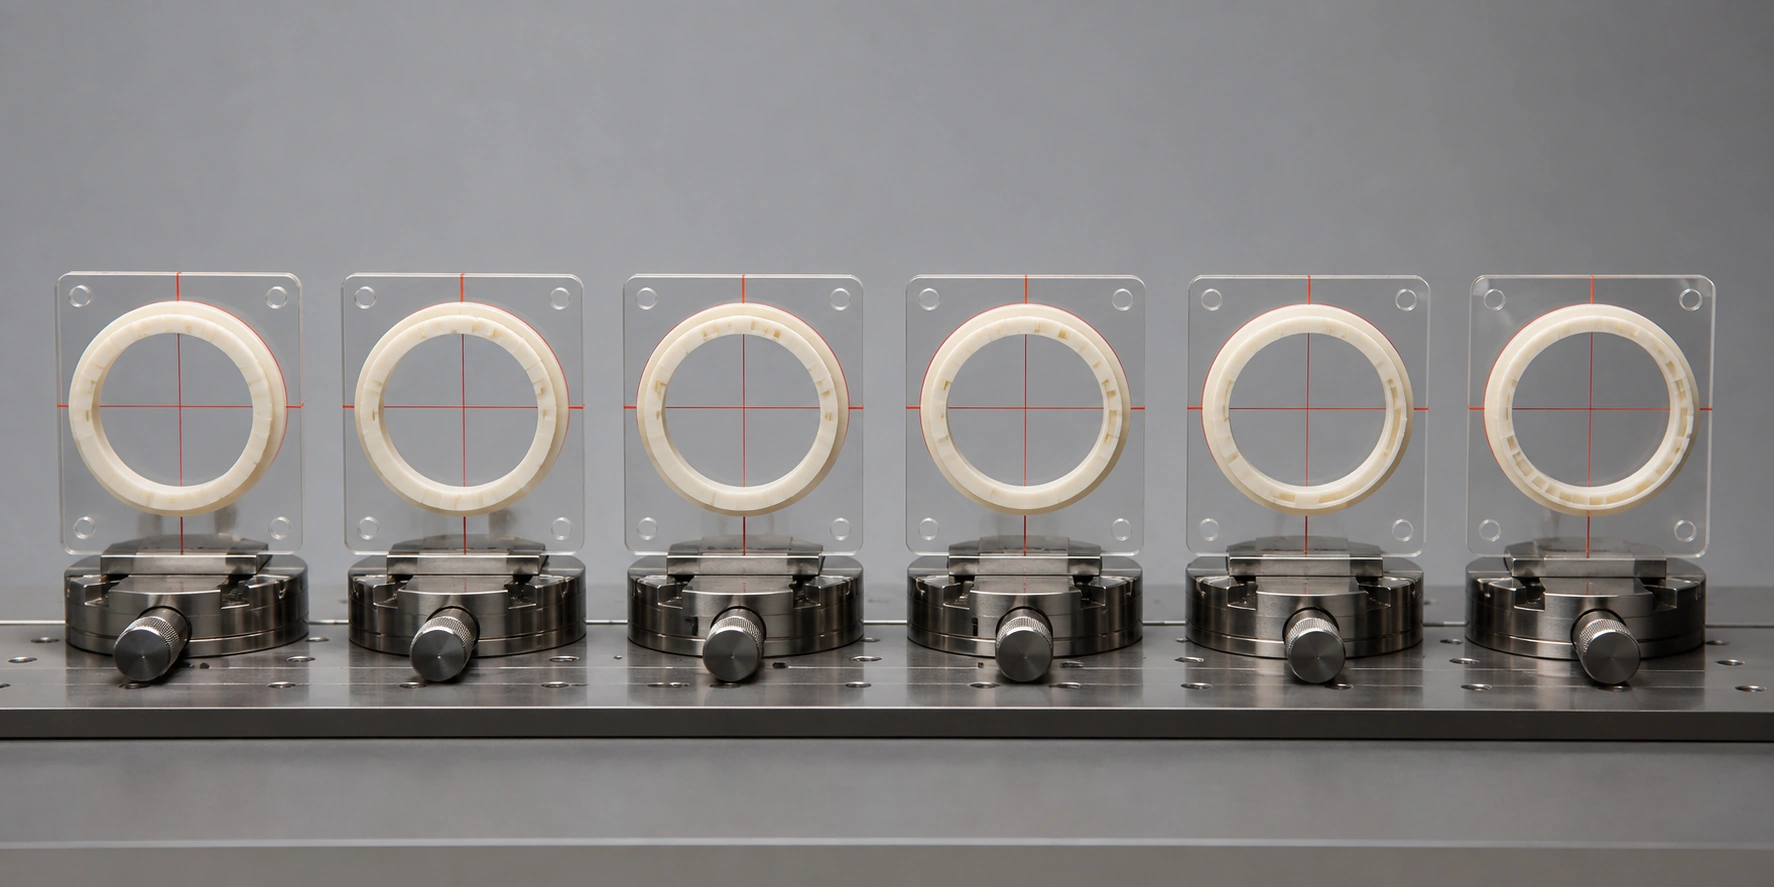
Measure the same datums, orientation, instrument, and free or constrained state. Randomize the measurement order when instrument drift is a concern.
-
Plot change from each part's first reading and compare it with measurement uncertainty. A flat-looking average can hide opposite cavity or flow-direction trends.
If the curve is stable from 24 to 48 hours, the narrow conclusion is that no movement larger than the study's detection limit was observed during that interval under that condition. It does not prove that the part is fully stabilized for seven days, a hot shipment, a paint bake, assembly preload, or service humidity.
Standardize the Measurement Condition
ISO 291:2008 specifies standard atmospheres for conditioning and testing plastics. ISO currently lists the 2008 edition as published; the page also shows it under review, with no replacement edition published as of August 25, 2026. [2] A drawing or inspection plan can reference the applicable atmosphere or state a project-specific one when service simulation is required.
For comparable dimensional data, define:
-
the exact resin producer, grade, color, reinforcement, and lot;
-
the molding date, cavity, process revision, and actual A-side and B-side steel temperatures at defined locations;
-
elapsed time from ejection to conditioning and measurement;
-
temperature and relative humidity during storage and inspection;
-
dry-as-molded, conditioned, annealed, painted, sterilized, or other final material state;
-
free-state or assembly-fixtured measurement, including the fixture and applied force;
-
instrument, datum scheme, resolution, calibration status, and measurement-system study;
-
the service or shipping exposure that the result is intended to represent.
For polyamide, the state label is essential. An experimental UL Prospector study measured PA6, PA66, and PA46 plaques first in a moisture-protected dry-as-molded state, then during accelerated moisture conditioning. It observed material- and reinforcement-dependent dimensional change, illustrating why “nylon” and “conditioned” are not complete specifications. [3]
Read the Curve Before Changing Steel
Different patterns suggest different next tests:
Fast Change Followed by a Plateau
This pattern is consistent with cooling toward the measurement atmosphere, possibly combined with early stress relaxation or crystallization. Repeat the study at a controlled initial part temperature. Do not call it normal merely because it finishes quickly; compare the final state with the functional requirement.
Continued Contraction Beyond the First Day
For a semi-crystalline grade, sustained contraction may be consistent with post-mold crystallization or stress relaxation. Compare the actual mold temperature, hold condition, wall thickness, and supplier guidance. A later thermal exposure can reveal additional movement that room-temperature storage did not complete.
Expansion or Contraction That Tracks Humidity
Moisture uptake or loss becomes a stronger hypothesis, particularly for polyamides. Run controlled dry and conditioned states, measure mass as well as dimensions where useful, and return both states to the reference atmosphere to assess reversibility. Packaging and transport time are part of the experiment.
A Step Change After Heating
Separate reversible thermal expansion from permanent change by cooling the part back to the defined measurement atmosphere before remeasuring. Any residual difference can reflect accelerated crystallization, stress relaxation, or another material change. One heat exposure does not identify which mechanism acted.
Mold Temperature Can Trade Early Size for Later Stability
The current Delrin molding guide states that a lower mold temperature gives shorter crystallization time in the mold, a shorter cycle, and lower immediate mold shrinkage, but higher post-mold shrinkage—especially when parts later see elevated temperature. It advises balancing mold temperature against short- and long-term dimensional precision. [4]
BASF's Ultraform POM guide shows why conditions must accompany every number. Its shrinkage figures identify the exact grade, specimen thickness, melt and mold temperatures, hold pressure/time, measurement time, and later storage or heating condition. The same guide plots shrinkage and after-shrinkage against mold temperature and time. [5] Those data support the direction of the trade-off for the tested POM; they are not a shrinkage table for every POM or every production geometry.
The practical decision is to choose the grade-specific mold-temperature window for total dimensional behavior, not just the earliest inspection. Measure steel at the cavity rather than relying only on a temperature-control-unit display, and investigate A-side/B-side imbalance when dimensions or warpage differ across the part.
Hold pressure and hold time also affect the starting state by changing how much material is packed before gate seal. Fill speed and gate location influence orientation. Annealing or another heat treatment can accelerate movement, but it becomes part of the production definition and must be validated before final measurement. None of these levers corrects filler-orientation anisotropy automatically.
Match the Study to the Material Mechanism
| Material situation | Measurement plan | Important boundary |
|---|---|---|
| Unfilled or filled POM | Use the supplier's mold-temperature and measurement guidance; compare at agreed early and later times; add a service-temperature exposure when relevant. | Filled and unfilled grades can differ in magnitude and direction; do not transfer one grade's shrink factor. |
| PA6, PA66, or another moisture-sensitive polyamide | Report dry-as-molded or the defined conditioned state; control packaging and humidity; measure along relevant flow directions. | Time to moisture equilibrium depends on grade, thickness, reinforcement, and environment; a universal 48-hour wait is not defensible. |
| PP or another semi-crystalline polyolefin | Track early and later dimensions under one storage condition; record mold temperature, flow direction, packing, and packaging temperature; add a service-temperature exposure when relevant. | Polyolefin shrinkage is time-dependent, and warm packing or storage can extend the change. The supplier guide reports about 90% of total shrinkage after 48 hours only as a general family observation, not an acceptance rule for a specific PP grade or part. [7] |
| Filled semi-crystalline resin | Measure parallel and normal to expected flow and by cavity; review gate and fiber orientation. | A stable average can hide directional or cavity-specific movement. |
| Amorphous thermoplastic | Crystallization-related post-shrinkage is not the main mechanism, but cooling, frozen stress, moisture sensitivity, and thermal exposure can still move dimensions. | “Amorphous” does not mean dimensionally invariant. Use the actual grade and service history. |
Use Capability Statistics Only After Stability Is Shown
Thirty consecutive parts can be a useful T1 screening batch for cavity spread and time-dependent movement, but it is not automatically a formal capability study. NIST defines process capability as a comparison between specification limits and the natural variability of a stable process and cautions that capability-index estimates rely on distributional and process assumptions. [6]
Before reporting Cp or Cpk, establish measurement-system suitability, process stability, rational subgrouping, cavity treatment, and a sample size appropriate to the customer's quality plan. Otherwise, a precise-looking Cpk can summarize a mixture of process drift, post-mold movement, and measurement timing rather than capability.
Put Time and Condition Into the T1 Handoff
Our manufacturing materials overview and plastic injection molding service provide public starting points for grade and process discussions. Our inspection workflow lists DFM, incoming-material, T1 dimensional, in-process, and pre-shipment checkpoints.
For a post-mold-shrinkage risk, the project specification should add the elapsed time, conditioning atmosphere, moisture state, actual mold-temperature record, free or fixtured state, and any later measurement point to the T1 report requirement. These additions turn “full dimensional inspection” into comparable evidence across sites; they are project-specific recommendations rather than capabilities stated on our public page.
Frequently Asked Questions
Is 48 hours the correct waiting time for every molded plastic part?
No. Forty-eight hours is a useful possible checkpoint, not a universal stabilization time. The correct inspection state depends on resin, grade, thickness, mold conditions, humidity, service exposure, and the controlling drawing or standard.
Why does a nylon part grow after molding?
Moisture uptake is a common contributor, but the magnitude and rate depend on the polyamide chemistry, reinforcement, thickness, temperature, humidity, and starting state. The report should say dry-as-molded or define the conditioning procedure.
Can annealing eliminate post-mold shrinkage?
Annealing can accelerate crystallization or stress relaxation for some grades, but it can also reveal distortion. It does not remove flow-induced anisotropy and should be treated as a validated production operation, not an undocumented repair.
Should Cp and Cpk be calculated from the first 30 parts?
Only as a clearly labeled preliminary estimate if the study design supports it. Formal capability requires a stable process, a capable measurement system, suitable sampling, and defined handling of cavities and time-dependent dimensions.
Conclusion
Post-mold shrinkage is best managed as a time-and-condition problem. Track the same parts from ejection through defined checkpoints, control the inspection atmosphere and constraint state, label moisture-sensitive materials correctly, and compare movement with measurement uncertainty. Use the resulting time signature to choose the next material, process, tooling, or conditioning test before cutting steel. When both supplier and customer measure to the same clock and state, “good here, bad there” becomes an engineering result that can be explained and corrected.
Sources
[1] ISO: ISO 294-4:2018 — Determination of Moulding and Post-Moulding Shrinkage
[2] ISO: ISO 291:2008 — Standard Atmospheres for Conditioning and Testing
[3] UL Prospector: Polyamide Moisture Absorption and Relative Dimensional Change
[4] Delrin: Technical Molding Guide, 2024
[5] BASF: Ultraform POM Product and Processing Brochure