-q4gvl4k29y4hq8j9rjpapvj0ft06fje63olt7p210i.png "HordRT Logo-2023(red)")

Injection pressure isn't one number on a machine display. It's a curve that moves through three distinct phases, and misreading any one of them is how a process ends up with short shots, flash, sink marks, or parts carrying enough internal stress to crack months after they ship. Understanding the fill-pack-hold sequence, and how to read the pressure curve it produces, is the difference between tuning a process by feel and tuning it with data.
This guide breaks down each phase, where pressure gets lost on the way from the nozzle to the cavity, and how cavity pressure monitoring turns a black-box process into something measurable.
The Three Phases of the Pressure Curve
A single injection cycle moves through fill, pack, and hold, and each phase is controlled differently even though they happen back to back in seconds.
Fill: Speed-Controlled, Pressure-Reactive
During fill, the machine controls injection speed and lets pressure rise as a result, not the other way around. As the melt front advances through narrowing flow paths, pressure climbs in response to resistance, and the press switches from velocity control to pressure control at a defined transition point, commonly called the V/P (velocity-to-pressure) switchover.
Pack: Compensating for Shrinkage
Once the cavity is volumetrically full, the process shifts into the pack phase, which adds material to compensate for the volume the plastic loses as it cools and shrinks. A US patent on automated molding control describes initial packing and holding pressure as typically around 10% of the pressure present at the end of the velocity-controlled fill phase, then incremented in steps of roughly 5% as the process is tuned [1]. That low starting point and gradual increase is a deliberate strategy to avoid overpacking on the first trial shots.
Hold: Maintaining the Gate Seal
Hold pressure keeps the gate sealed until the material at the gate freezes, preventing molten plastic from flowing back out of the cavity. Hold time should extend slightly past the point where part weight stops increasing, since cutting it short before the gate freezes lets the part lose mass and develop sink marks near the gate.
Where Pressure Gets Lost Along the Flow Path
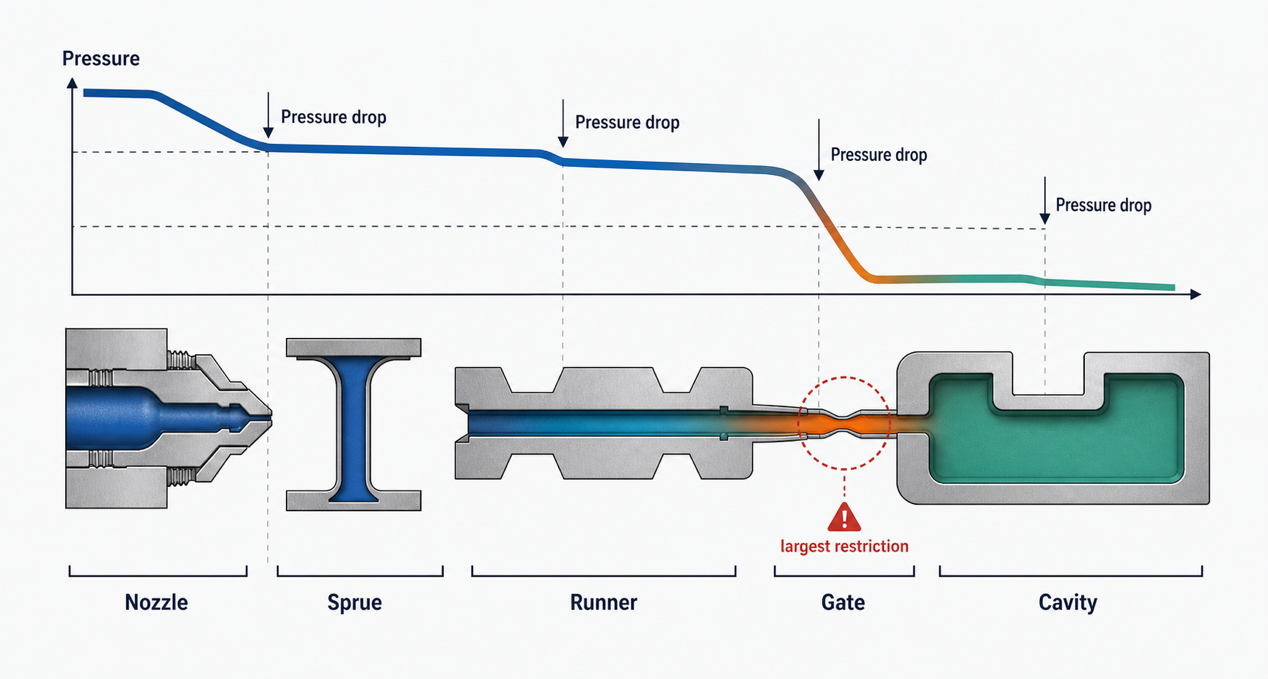
Pressure measured at the nozzle is not the pressure the cavity actually sees. Every section of the flow path, from nozzle to sprue to runner to gate to cavity, drops some pressure, and the gate is typically where the largest drop occurs because it's the smallest cross-section in the path.
Why Runner Balance Matters
When a multi-cavity tool has unevenly sized or unevenly laid-out runners, pressure arrives at each cavity differently, which produces inconsistent fill even when every cavity nominally receives "the same" shot. An imbalanced runner system wastes available clamping force and creates exactly the kind of cavity-to-cavity variation that's hardest to diagnose from the outside, since each cavity can look fine in isolation while still being out of spec relative to the others.
Gate Geometry Sets the Floor
A gate that's undersized for the part's wall thickness forces material through at higher velocity and shear, which raises local pressure loss and melt temperature at the gate. Gate depth is generally sized as a fraction of the adjoining wall thickness, and getting that ratio wrong either starves the cavity of pressure during fill or creates excessive shear heating that shows up as degradation near the gate.
Reading the Cavity Pressure Curve
Cavity pressure sensors measure pressure directly inside the mold, not inferred from screw position or hydraulic pressure at the machine, which is why they're considered the most reliable window into what's actually happening in the cavity.
What a Healthy Curve Looks Like
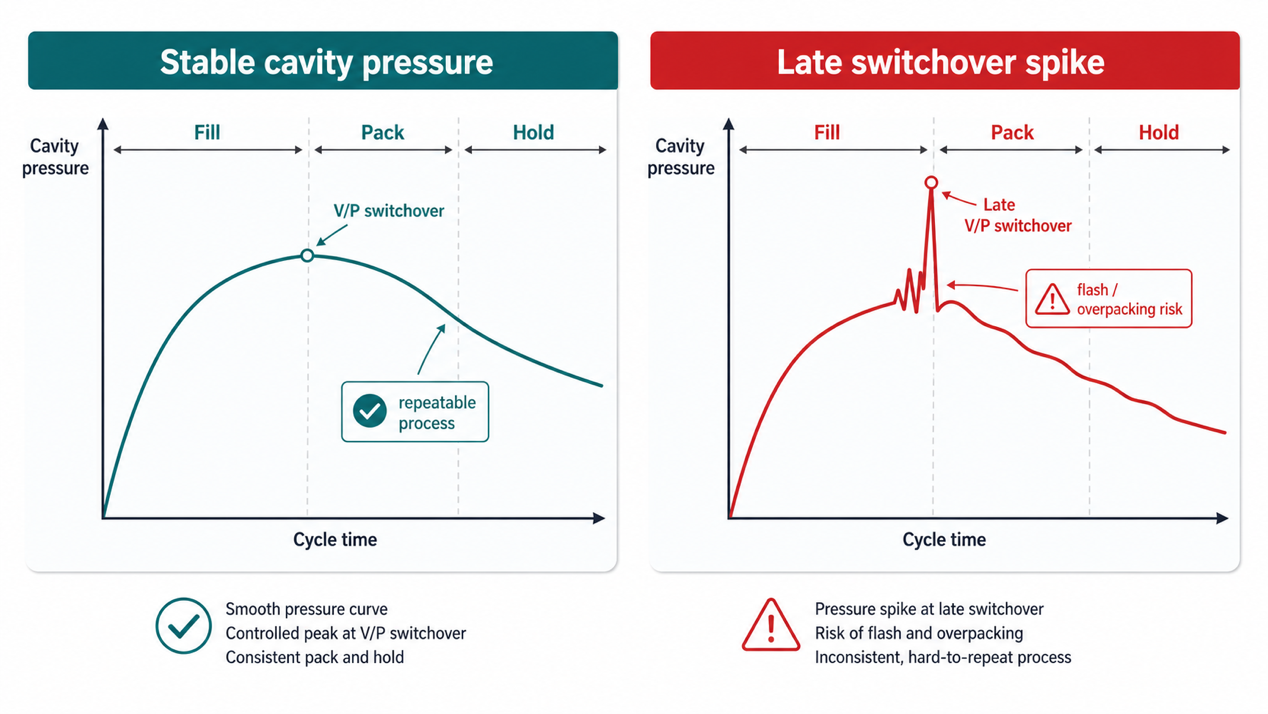
A repeatable, well-tuned process produces a smooth pressure rise during fill, a controlled peak near the V/P switchover, and a gradual decline through pack and hold as the gate freezes. Academic process-monitoring studies divide the curve into four phases — filling, melt compression/packing, holding, and cooling — and use the curve's shape, not just its peak value, to diagnose process health [2].
What a Jagged Curve Means
A sharp spike right at switchover usually indicates the transition happened too late, after the cavity was already volumetrically full, which is a common root cause of flash. In one documented case, adjusting the V/P switchover screw position from 30mm to 60mm eliminated a pressure spike at the end of fill and produced a smoother packing-phase curve, resolving a flash defect that earlier melt-temperature and speed adjustments alone had not fixed [3].
Cavity Pressure as a Quality Predictor
The relationship between cavity pressure and part outcome is strong enough to use cavity pressure data as a quality signal on its own. One study testing a micro-injection process found that the area under the cavity pressure curve correlated with part weight at an R² of 0.86, compared to 0.77 for peak pressure alone, indicating the curve's shape carries more diagnostic value than a single peak number [4].
Common Mistakes and Their Symptoms
| Mistake | Resulting defect |
|---|---|
| Switchover too early | Short shots, incomplete fill |
| Switchover too late | Flash, overpacking stress, weld line weakness |
| Insufficient pack time | Sink marks, internal voids |
| Excessive pack pressure/time | Flash, part sticking, molded-in stress |
A controlled experiment that optimized V/P switchover position, fill-stage speed, and first-stage holding pressure on an integrated circuit tray reduced part warpage by 40%, from 0.042mm to 0.025mm, and reduced width deviation at the end of the fill pattern by 54%, from 0.024mm to 0.011mm, compared to the initial process settings [5]. Neither warpage nor width deviation required a mold change. Both responded to pressure-phase tuning alone.
Rules of Thumb for Setting Up the Process
These starting points exist to shorten the trial-and-error loop, not to replace cavity pressure data once it's available.
Starting Pack Pressure
Begin packing and holding pressure low, around 10% of the pressure recorded at the end of the velocity-controlled fill phase, and increase it in roughly 5% increments while watching part weight and visual quality at each step [1]. This avoids the common failure mode of starting too aggressive and overpacking before the curve has even been characterized.
Confirming Switchover Position
Switchover position should be validated by short-shot studies: progressively filling the cavity in stages approaching full volume and checking part weight and appearance at each stage, rather than set once from a simulation and left untouched.
Using Cavity Pressure Over Hydraulic Pressure
Hydraulic or nozzle pressure readings reflect what the machine is doing, not what the cavity is experiencing, since viscosity shifts, mold temperature drift, and runner imbalance all happen between the nozzle and the cavity. Cavity-mounted sensors close that gap, which is why process engineers increasingly treat them as the primary tuning reference rather than a secondary check.
Putting Cavity Pressure Data to Work in Production
Reading a pressure curve correctly only pays off if a manufacturing partner is actually instrumenting the process rather than tuning by trial and error on every run. HordRT uses cavity pressure monitoring during process validation across our injection molding services, which is particularly useful for catching switchover timing and cavity-to-cavity imbalance in multi-cavity tools before they produce scrap. The honest caveat: cavity pressure sensors add tooling cost and lead time, so for very low-volume prototype runs where a handful of short-shot trials get the process close enough, full pressure instrumentation isn't always the most cost-effective starting point.
Conclusion
Fill, pack, and hold are three different control problems wearing one continuous pressure curve. Treat switchover as a measured event, not a guess, set initial pack pressure low and build up from there, and read the cavity pressure curve's shape, not just its peak. That combination is what separates a process tuned on data from one tuned on hope, and it's the single highest-payoff habit available to most molding operations.
Sources
-
Brett, L. (assignee). "Automated molding technology for thermoplastic injection molding." US Patent 7,431,870. United States Patent and Trademark Office. https://image-ppubs.uspto.gov/dirsearch-public/print/downloadPdf/7431870
-
"Research on Quality Characterization Method of Micro-Injection Products Based on Cavity Pressure." Polymers, 2021. https://www.ncbi.nlm.nih.gov/pmc/articles/PMC8398340/
-
"In-cavity pressure measurements for failure diagnosis in the injection moulding process and correlation with numerical simulation." The International Journal of Advanced Manufacturing Technology, 2023. https://link.springer.com/article/10.1007/s00170-023-11100-1
-
"Research on Quality Characterization Method of Micro-Injection Products Based on Cavity Pressure." Polymers, 2021. https://www.ncbi.nlm.nih.gov/pmc/articles/PMC8398340/
-
"Influence of V/P switchover point, injection speed, and holding pressure on quality consistency of injection-molded parts." Journal of Applied Polymer Science, 2021. https://onlinelibrary.wiley.com/doi/abs/10.1002/app.51223

-2.png)